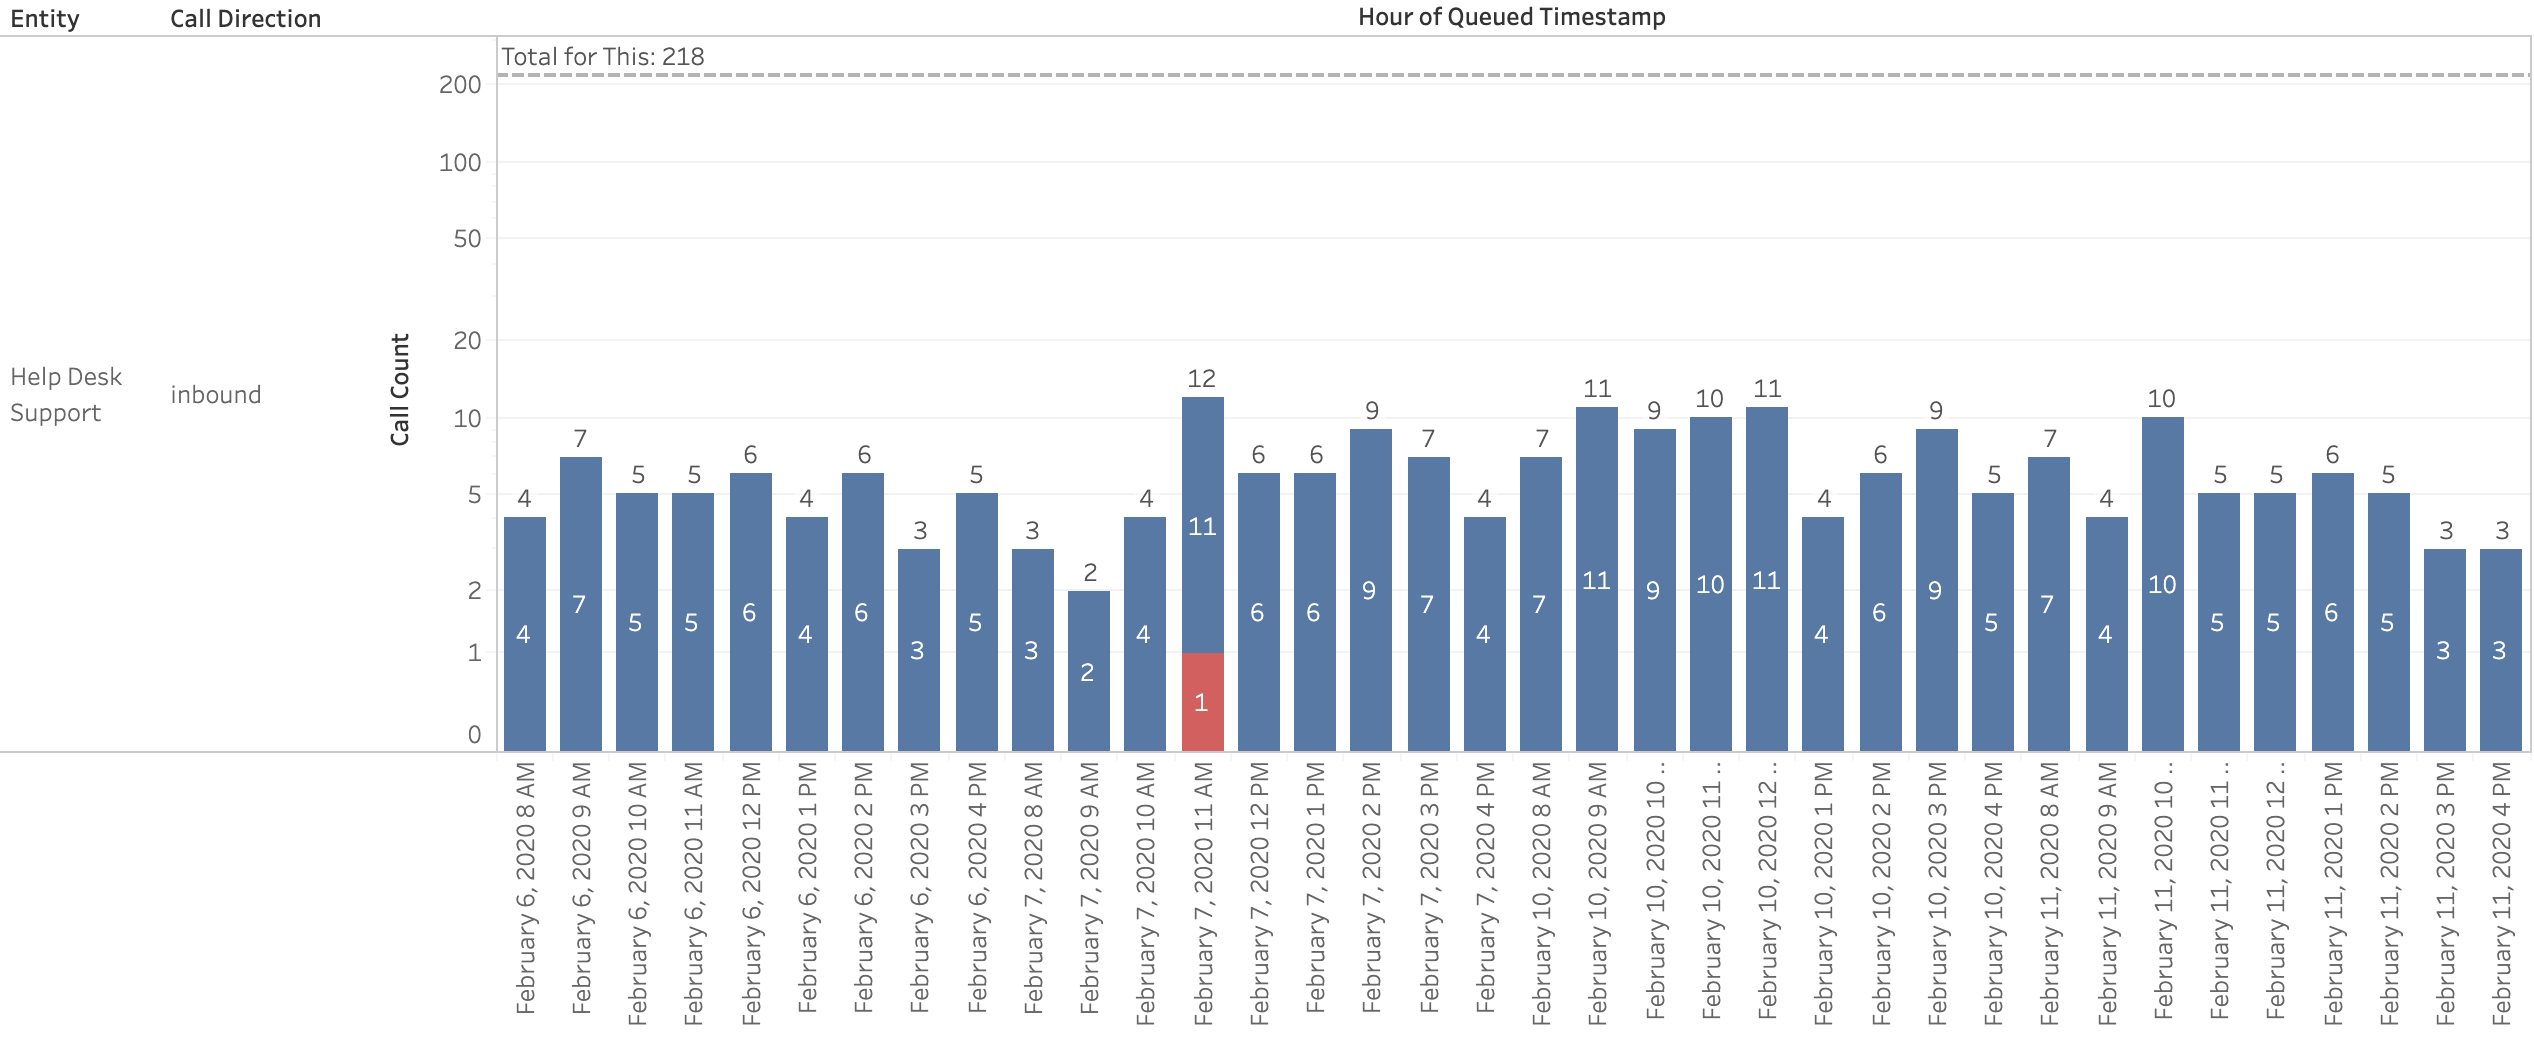
Plots call volume as a stacked bar chart, line plot, or tabular format. Date groupings can be adjusted to be highly granular or coarse depending on need providing detailed or summary reporting. Handling Disposition for filtering indicates what ultimately became of a call. Agent Hungup (Outbound) indicates an outbound placed call that has ended normally, Normal clearing indicates an inbound call from Queue that was answered and hung up normally by the handling agent, and Caller Abandoned indicates calls in which callers were placed in Queue waiting for an available Agent but hung up before any Agent became available. The stacked bar chart and line plot counterparts will always render Call Volume per Queue on separate plots. These visualization styles are intended to be used for side-by-side comparative analysis of Call Volumes. Hovering a cursor over any point on these visualizations will bring up associated metrics corresponding to that particular point (e.g.: the day, week, etc. - however the date groupings are set per zoom level). Use the tabular format best representation of overall totals. |