...
| Section |
|---|
| Column |
|---|
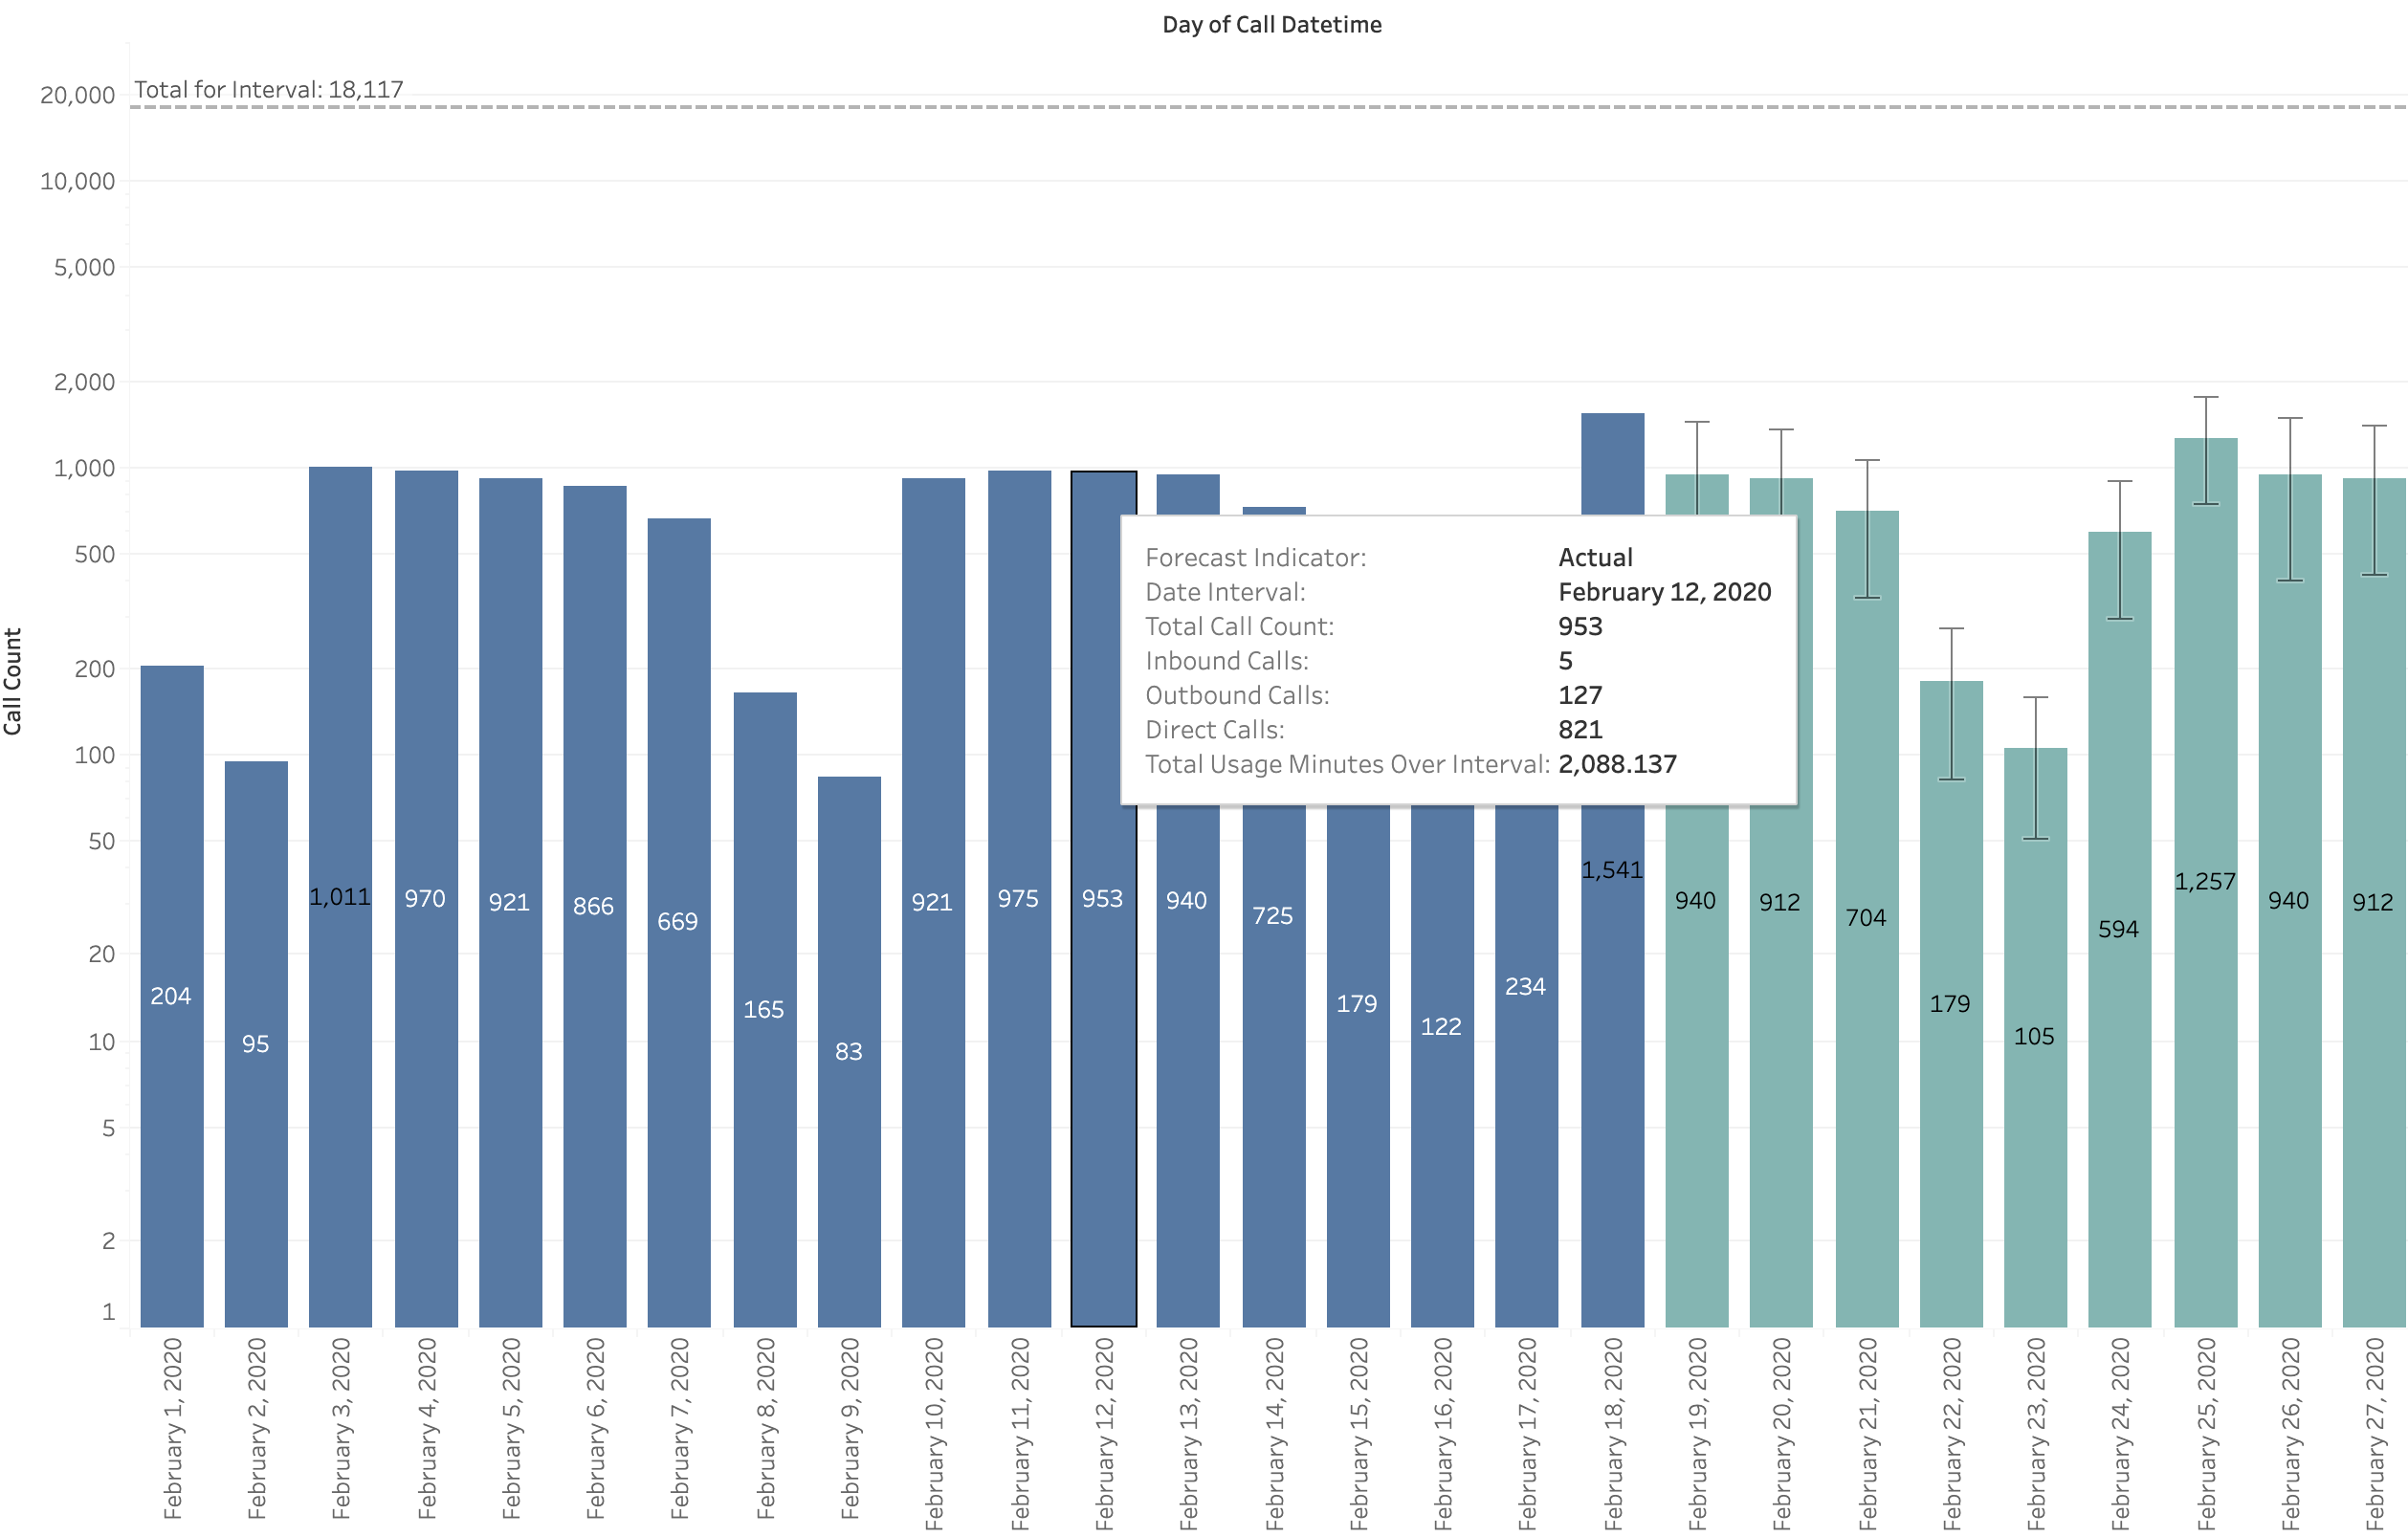
Reports as a stacked bar chart or tabular format the overall call volume on the account. The factors for call volume can be filtered by the Extension Class, Phone Number, and call direction. This is a summary report and does not provide the minutia data. For detailed call volumes, you should use the Call Volume report instead. The tabular format counterpart will heat map the row values column-wise per column. Heat mapping does not evaluate all row values across multiple columns. When sufficient data is present over the date range and relative to the date grouping by zoom level, a forecast of call volume may be generated. Hovering your cursor over any individual bar plot will provide additional information relative to the bar hovered on. Forecasts are rendered in a different color and the hover tooltip will indicate the selected as being Actual (historical data) or Forecast (based on the available historical data). Naturally, the most data available relative to the date grouping the better the Forecast's statistical model. |
| Column |
|---|
|
|
Call Volume
| Section |
|---|
| Column |
|---|
| Reports as a tabular format the subtotals of calls meeting the selected criteria and presenting the rows either by Phone Number or Extension Number. Heat mapping is applied column-wise per column. Grand Total is provided for the full data set that is rendered based on selections for filtering, parameters, and date ranges. |
| Column |
|---|
|  Image Added Image Added
|
|
Call Volume by Number
Reports call volume by phone number in a tabular format. Heat mapping is applied column-wise per column. While the Call Volume report has some flexibility to produce the same reporting, due to it being able to accommodate call volume by extension or phone number, filtering options are not extensive based on phone number.
...