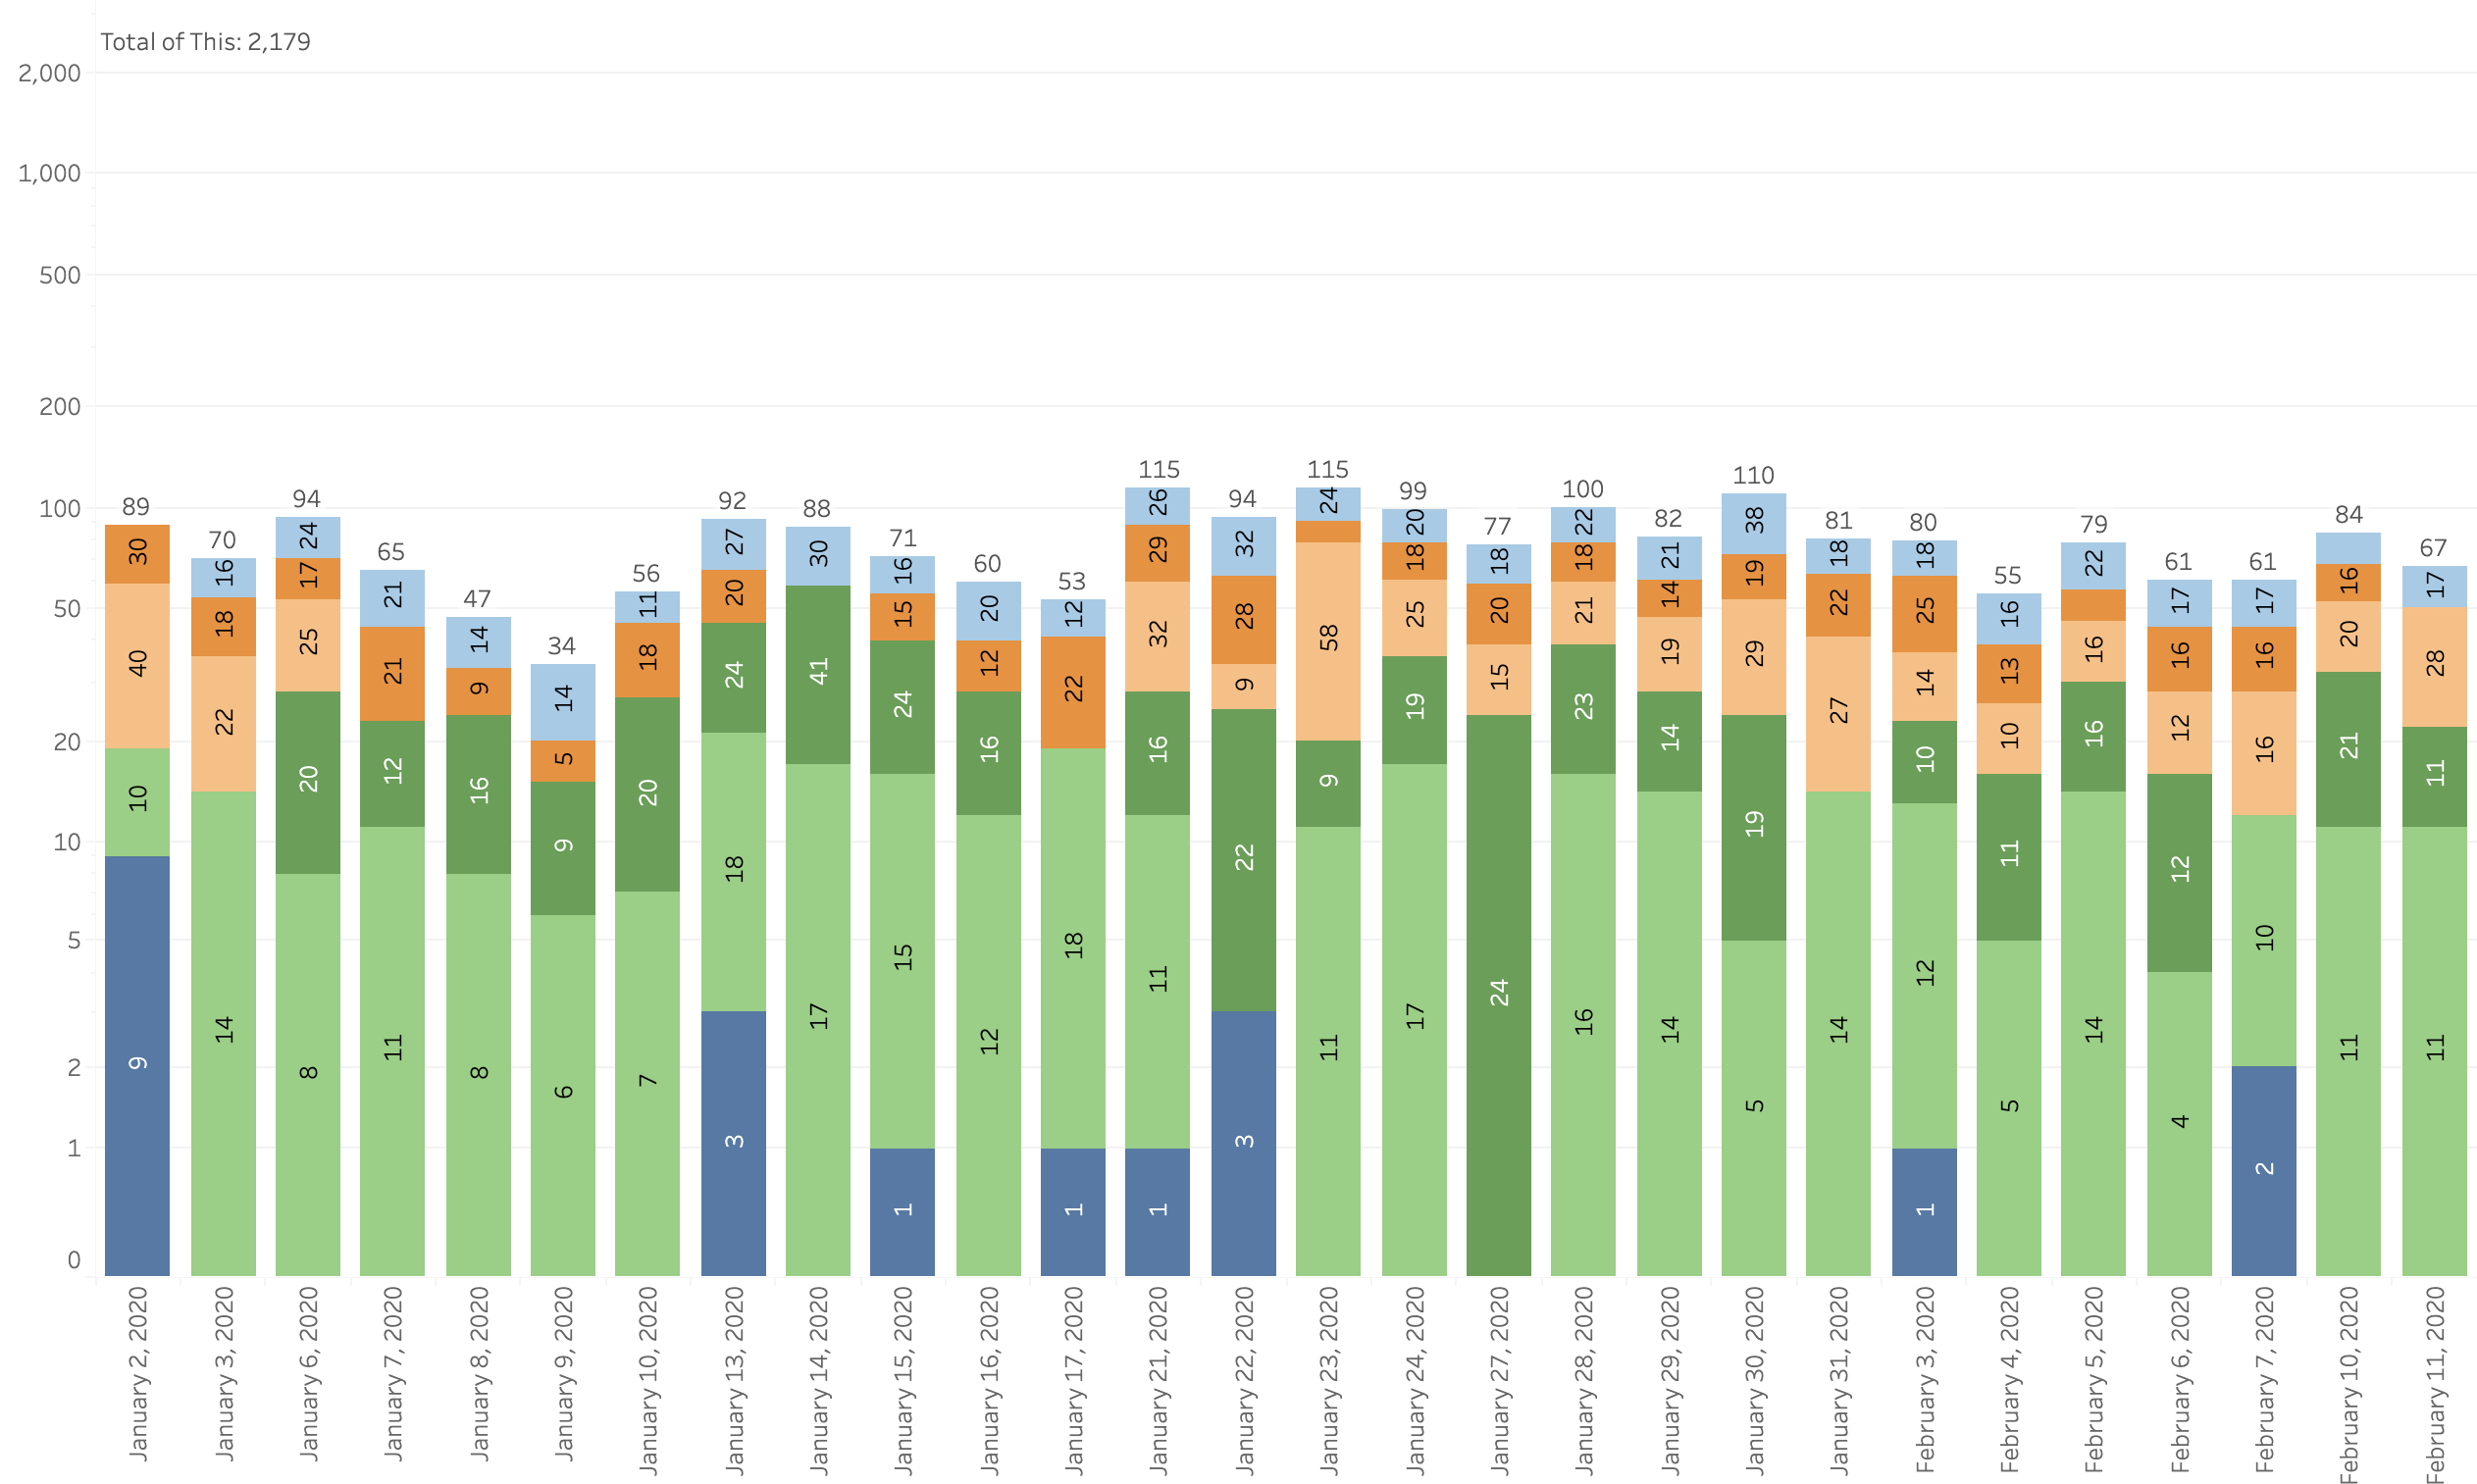
Renders calls taken by the pertinent selected Agent(s) over the specified date interval as a stacked bar chart or tabular format. Hovering over any segment of the individual bars (date grouping) will provide stats relative to that single Agent and the date grouping in the bar chart counterpart. The tabular format forms a hierarchy of Agent=>Queue=>Date Grouping. To summarize the agent calls, it is recommended to simply adjust the date interval Zoom Level until there is one row per agent:queue:date grouping. The calls plotted only factor in calls Agents have answered or placed and do not represent calls the agent was offered but missed. The visualization uses a logarithmic scale on the y-axis to prevent very small values from being imperceptible when plotted with very large values. The Calls Taken field does not distinguish between calls that were offered and answered and calls that were offered but not answered (redirects). |